Malibu’s 2025 real estate market was a year of more choices, tougher competition, and pickier buyers, especially early on. Inventory climbed above 2024 levels every single month, fueled by a big surge of new listings in January and February (mostly due to the fires). But while more sellers stepped into the ring, far fewer deals closed, which pushed months of supply to unusually high levels and made pricing strategy matter more than ever. As the year went on, the market found its footing, activity improved into late summer and fall, but the overall tone stayed buyer-leaning, with more balanced negotiating power showing up in the second half of the year.
How to read this article: We break the recap into a set of “market lenses,” each comparing data of 2025 to 2024 month-by-month. The lenses used are active listings, new listings, closed sales, months supply, days on market, % of last list price, and average sold $/sq ft. Each lens on its own is compared to other lenses to tell a comprehensive story of the Malibu Market for 2025.
Before You Read: This was an unusual year due to the Palisades Fire. As you read you will find statistical outliers during January, February and early 2025 that should be read within this context.
Too Long Didn't Read:
- Inventory was higher all year: active listings averaged ~17% above 2024.
- More sellers listed early: new listings were up ~16% overall, with a huge Q1 jump.
- Fewer deals closed: 2025 sales volume was down ~31% vs 2024.
- Buyer leverage increased: months supply roughly doubled on average, and sales closed at a lower % of last list price (especially later in the year).
- Pricing softened later: average sold $/sq ft was down overall, with the biggest weakness in Q3–Q4.
- Bottom line - Far more homes came on the market, fewer homes sold, homes that did sell sold for comparatively lower prices than those in 2024 to match the market.
Active listings
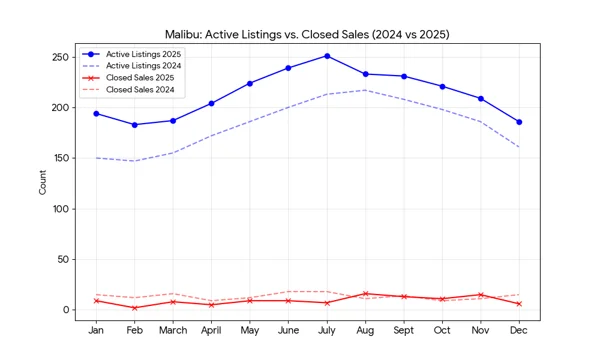
Big picture: Active inventory was higher every single month in 2025.
- Average active listings
- 2024: 182.8
- 2025: 213.5
- Net change: +30.8 listings on average (about +16.8% higher in 2025)
Where the increase was strongest: the start of the year.
- Q1 (Jan–Mar): ~+24.8% YoY (largest gap due to fires)
- Q2 (Apr–Jun): ~+19.5% YoY
- Q3 (Jul–Sep): ~+12.1% YoY (gap tightens)
- Q4 (Oct–Dec): ~+13.0% YoY
Most notable month-by-month pattern
- The YoY gap starts very wide (Jan +29.3%, Feb +24.5%) and steadily narrows into late summer.
- August is the tightest month: only +7.4% YoY (233 vs 217).
- Then the gap widens a bit again in fall/winter (roughly +11% to +15.5%).
Seasonality stayed consistent
- Both years build into the spring/summer and cool off toward winter.
- 2025 basically followed the same rhythm—just at a higher baseline.
What “Active Listings” means and what this trend suggests for 2025
Active listings are your visible inventory: how much Malibu buyers can choose from at a given time.
When active listings rise this consistently year-over-year, it usually means some mix of:
- More sellers entering the market, and/or
- Slower absorption (homes taking longer to sell), and/or
- More price discovery (homes sitting while sellers test pricing)
Practical takeaway for the 2025 story:
2025 looked like a market with more choice and more competition, especially in the first half of the year. That tends to shift leverage toward buyers, increase the importance of pricing + presentation, and create more negotiation room (you’ll see this echoed, or contradicted, once we look at Days on Market, Months Supply, and % of last list price).
New listings
Big picture: 2025 brought more new inventory onto the market.
- Total new listings
- 2024: 391
- 2025: 455
- Change: +64 listings (+16.4%) YoY
Where the increase happened
- Q1 (Jan–Mar): 90 → 137 (+52%) ← major surge, fire related
- Q2 (Apr–Jun): 119 → 136 (+14%) ← still higher
- Q3 (Jul–Sep): 111 → 108 (-2.7%) ← basically flat/slightly lower
- Q4 (Oct–Dec): 71 → 74 (+4.2%) ← small increase
Monthly callouts
- Jan (+61%) and Feb (+72%) were the big flood months related to people listing their homes after the Palisades Fire.
- Aug (-27.5%) was the standout dip.
- Fall was mixed, but not the driver of 2025’s higher inventory—Q1 was.
What “New Listings” means and what this trend suggests for 2025
New listings are the supply pipeline: how many homes sellers are bringing to market.
The 2025 picture says:
- Inventory wasn’t only high because homes sat, it was also high because more sellers listed, especially early.
2025 was a market where sellers are competing harder for a smaller pool of committed buyers, at least in the first half.
Closed sales
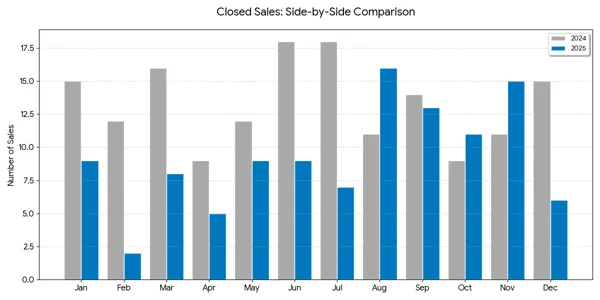
Big picture: 2025 had meaningfully fewer closed sales overall, but the year improved as it went.
- Total closed sales
- 2024: 160
- 2025: 110
- Net change: -50 sales (-31.25% YoY)
- Average closings per month
- 2024: 13.33
- 2025: 9.17
- Net change: about -4.17 closings/month
Quarter-by-quarter trend
This is what shows the shift in the market:
- Q1 (Jan–Mar): 43 → 19 (-55.8%)
- Q2 (Apr–Jun): 39 → 23 (-41.0%)
- Q3 (Jul–Sep): 43 → 36 (-16.3%)
- Q4 (Oct–Dec): 35 → 32 (-8.6%)
What the data says: 2025 started extremely slow (especially Feb), then recovered toward Fall, with Oct/Nov outperforming 2024, but December fell off again.
Monthly callouts
- February 2025: 2 closings vs 12 in 2024 (-83.3%) — Fires created a real freeze in closings.
- July 2025: 7 vs 18 (-61.1%) — another major dip.
- August 2025: 16 vs 11 (+45.5%) — notable rebound month.
- October + November 2025: up YoY (Oct +22.2%, Nov +36.4%) — strongest stretch.
- December 2025: 6 vs 15 (-60%) — sharp year-end slowdown.
What “Closed Sales” means and what this trend suggests for 2025
Closed sales are your cleanest “demand/absorption” metric: how many deals actually finished.
When closed sales drop while active inventory is up, it usually implies:
- Demand was softer and/or pickier, and
- Absorption slowed (more homes available relative to how many are selling), and
- Sellers faced more competition to win the buyer who is active
But the quarterly pattern matters:
2025 wasn’t stagnant at all. It was front-loaded weak and then strengthened into late summer/fall, suggesting buyers re-entered once conditions felt more workable (pricing, selection, general confidence, cool off from the fires).
Also: Malibu is a low-transaction, luxury market, so individual months can swing hard. That’s why the quarter trend is the most trustworthy narrative backbone.
Months Supply
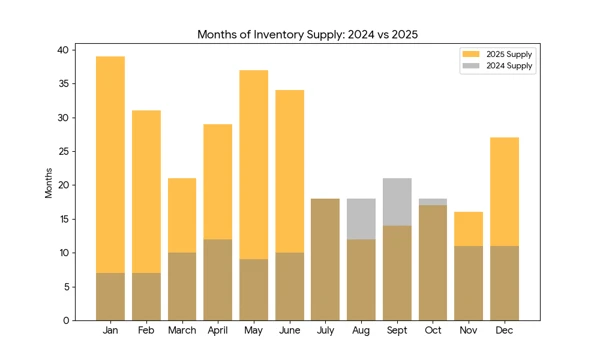
Definition of Months Supply: Months supply estimates how long it would take to sell the current inventory at the current pace of sales.
Big picture: Months supply in 2025 was dramatically higher overall, especially in the first half of the year.
- Average Months Supply
- 2024: ~12.7
- 2025: ~24.6
- Change: ~+94% higher on average in 2025
That is a massive shift, and it lines up cleanly with what we already saw:
- Active listings up every month in 2025
- Closed sales down overall in 2025 → Months supply is basically the “pressure gauge” that combines those two.
The real story is the shape of the year
1) Early 2025 = a supply shock (buyers had leverage)
- Q1 average
- 2024: 8.0
- 2025: 30.3 (+279%)
- Q2 average
- 2024: 10.3
- 2025: 33.3 (+223%)
And month-by-month really shows the difference:
- Jan: 7 → 39
- Feb: 7 → 31
- May: 9 → 37
- Jun: 10 → 34
This shows inventory is hanging around and sales pace is slower compared to 2024.
2) Late summer = reset / absorption improves
- Q3 average
- 2024: 19.0
- 2025: 14.7 (-22.8%)
Key callouts:
- Aug: 18 → 12 (down)
- Sep: 21 → 14 (down)
This matches the closed sales rebound (especially August), which would naturally pull months supply down.
3) Q4 = mixed (and then December spikes again)
- Q4 average
- 2024: 13.3
- 2025: 20.0 (+50%)
- Oct: 18 → 17 (basically flat)
- Nov: 11 → 16 (up)
- Dec: 11 → 27 (big jump)
So: fall looked healthier than early 2025, but year-end ended with more inventory overhang again.
What “Months Supply” means in 2025
- Higher months supply = slower market / more buyer power / more competition among sellers
- Lower months supply = tighter market / more seller power / more urgency among buyers
The Data says:
2025 started as a buyer-leaning market with a lot of listings relative to closings, then tightened in late summer, then loosened again into winter.
Days on Market
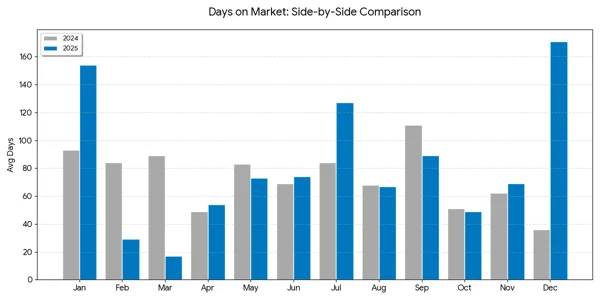
What “Days on Market” means
DOM measures how long it takes for homes to go under contract and/or close. In practical terms:
- DOM rising = buyers have more time, sellers have more competition, negotiations get easier for buyers.
- DOM falling = urgency increases, sellers have more leverage, pricing can be firmer.
Big picture: Days on Market (DOM) in 2025 was more volatile than 2024, with a few extreme months driving the headline change.
- Average DOM
- 2024: 73.25 days
- 2025: 81.08 days (+10.7%)
- Median DOM (more resistant to outliers)
- 2024: 76 days
- 2025: 71 days (slightly faster)
What this means: the typical deal wasn’t necessarily slower in 2025, but a handful of months had big slowdowns that pulled the average up.
The month-to-month pattern
1) Early year looks “fast” on paper — but it’s probably distorted
- Jan 2025: 154 days vs 93 (slower because of the fires)
- Feb 2025: 29 vs 84 (much faster)
- Mar 2025: 17 vs 89 (much faster)
Closed sales were extremely low in Feb (2) and Mar (8). When there are very few closings, DOM can swing widely depending on which exact homes happened to close (e.g., only the best-priced / most desirable properties). So I’d treat Feb/Mar DOM as statistically fragile, not a true market-wide speed-up.
2) Mid-year is mixed, then July slows hard
- Apr–Jun: basically similar (49→54, 83→73, 69→74)
- July 2025: 127 vs 84 (+51% slower) — clear logjam month
3) Late summer / fall looks healthier, then December blows up
- Aug: basically flat (68→67)
- Sep: improved (111→89)
- Oct: basically flat (51→49)
- Nov: slightly slower (62→69)
- Dec 2025: 171 vs 36 (huge slowdown) — major outlier
A 171 DOM month in Malibu usually means capitulating (price cuts, concessions, or unique properties taking forever to match with the right buyer)—but again, December also had only 6 closings, so it’s another month where a small number of weird deals can distort the average.
What DOM + Months Supply combination suggests for 2025:
- Early 2025 had very high months supply, but DOM looks “fast” in Feb/Mar likely because only the most compelling listings sold while other inventory sat.
- That’s a classic two-speed market: good stuff moves, everything else lingers.
- The July + December spikes support the idea that parts of the market got stuck, consistent with higher inventory and lower overall closings.
% of Last List Price
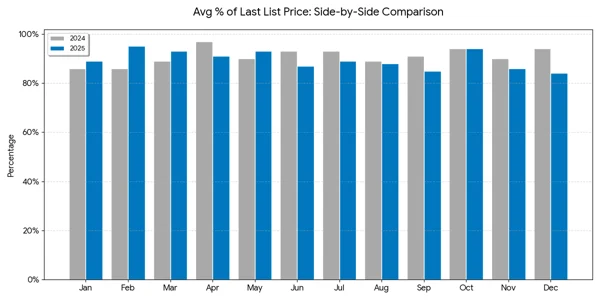
What is % of Last List Price?: It’s how much the home actually sold for compared to its most recent asking price, shown as a percent.
Big picture: 2025 closings tended to land slightly below the last asking price than 2024, but the bigger story is how the year “flipped” after Q1.
- Average % of last list price
- 2024: 91.0%
- 2025: 89.5%
- Change: -1.5 points in 2025
- Median
- 2024: 90.5%
- 2025: 89.0%
The trend that matters: strong Q1, softer back half
Quarter averages make the narrative really clear:
- Q1
- 2024: 87.0%
- 2025: 92.3% (stronger in 2025)
- Q2
- 2024: 93.3%
- 2025: 90.3% (weaker in 2025)
- Q3
- 2024: 91.0%
- 2025: 87.3% (weaker in 2025)
- Q4
- 2024: 92.7%
- 2025: 88.0% (weaker in 2025)
Month callouts
- Biggest YoY improvement: Feb 86% → 95% (+9 points)
- Biggest YoY weakness: Dec 94% → 84% (-10 points)
- Oct is identical: 94% → 94% (flat)
In total, 2025 beat 2024 in 4 months (Jan, Feb, Mar, May), was flat in Oct, and came in lower in 7 months, mostly in the back half.
What “% of Last List Price” means
This is your negotiation / pricing power metric.
- Higher % = sellers are holding price; buyers are paying closer to ask
- Lower % = buyers are negotiating harder; sellers are discounting more (or accepting lower offers after reductions)
What the 2025 pattern suggests
This fits a very Malibu, very 2025 two-speed market:
- Early 2025 looks strong on this metric (higher % than 2024), even though your closed sales were way down and months supply was way up. That usually means: only the best deals were getting done (the most compelling listings still commanded strong terms), while the rest of the market sat.
- From summer into year-end, the % falls meaningfully (mid/upper-80s), which lines up with inventory pressure and slower periods in DOM. That’s the inventory overhang showing up as real buyer leverage, not just theoretical leverage.
Average Sold $/Sq Ft
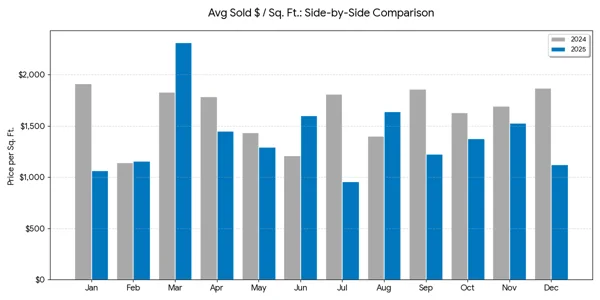
Big picture: the average sold $/Sq Ft was lower in 2025, and the weakness was concentrated in the back half of the year.
- Average sold $/Sq Ft
- 2024: $1,632
- 2025: $1,395
- Change: -14.6% YoY
- Median (helps cut through outlier months)
- 2024: $1,741
- 2025: $1,335
- Change: -23.4% YoY
Quarter pattern
- Q1: ~$1,629 → ~$1,513 (-7.1%)
- Q2: ~$1,479 → ~$1,449 (-2.0%)
- Q3: ~$1,690 → ~$1,275 (-24.6%)
- Q4: ~$1,732 → ~$1,342 (-22.5%)
Spring held up, then late summer + year-end softened sharply.
Month callouts
Upside months:
- Mar: $2,316 (+26.6%)
- Jun: $1,600 (+31.9%)
- Aug: $1,641 (+17.2%)
- Feb: basically flat (+1.0%)
Downside months:
- Jul: $959 (-47.0%)
- Jan: $1,065 (-44.3%)
- Dec: $1,123 (-40.0%)
- Sep: $1,224 (-34.2%)
What “Sold $/Sq Ft” means
Sold $/Sq Ft is a pricing signal, but in Malibu it’s also a mix signal.
Because the market is low-volume and highly varied (oceanfront vs hillside, remodel vs fixer, different size brackets), $/Sq Ft can swing hard depending on which properties closed that month.
That said, the pattern is pretty consistent with everything shown:
- Inventory higher all year (active listings up)
- Closings down overall
- Months supply spiking early
- % of last list price weakening in the back half
- DOM volatility with big slow months
Put together:
- 2025 had more buyer leverage overall, and
- the second half of 2025 saw more discounting / softer clears, and/or a shift away from the highest $/Sq Ft trophy mix compared to 2024.
The Malibu 2025 market story
Here’s the clean narrative
1) Q1: More sellers showed up, but buyers didn’t.
- New listings: way up (Jan/Feb surge)
- Active inventory: up ~20–30% YoY
- Closed sales: collapsed (especially Feb)
- Months supply: sky-high (31–39 months early)
What this means: Malibu started 2025 with a supply-heavy backdrop and a demand hesitation. It’s the kind of start where the only properties that trade are the ones priced right or uniquely desirable—everything else sits.
2) Spring: the market functions, but leverage tilts toward buyers
- Active inventory stays elevated
- Closed sales still lag 2024
- % of last list price starts to soften compared to 2024 (more discounting)
- $/Sq Ft is mixed (not a straight-line drop)
What this means: This is classic price discovery. Deals happen, but they take sharper pricing/terms unless the property is an obvious winner.
3) Late summer into fall: absorption improves, then negotiating power shows up
- Months supply drops below 2024 in Aug/Sep
- Closed sales narrow the gap; Oct/Nov actually beat 2024
- % of last list price weakens in the back half (more buyer leverage in negotiations)
What this means: Buyers re-engaged, but they negotiated. The market got more “liquid,” but not more “frothy.”
4) December: end-of-year drag (thin volume, lower averages)
- Very low closings + very high DOM + weaker % of list
- $/Sq Ft prints low again
What this means: Year-end looked like a market clearing older/staler inventory (or simply a small batch of weird closings skewing averages). Either way, it reinforces that 2025 finished with inventory pressure still present.
The Best Real Estate Agent in Malibu CA
If you’re thinking about Malibu in 2026, the takeaway from 2025 is simple: strategy matters. More inventory and more negotiation room can be a huge advantage if you know how to use it, and it can be expensive if you don’t.
Whether you’re trying to Buy A Home in Malibu CA, sell with a clear pricing plan, or just want a second opinion on what’s happening in your specific pocket of Malibu, Shen Realty can help you read the market and move with leverage, not hope. Work with a Malibu real estate agent who actually tracks the numbers, understands the micro-markets, and can tell you when to push, when to wait, and when to move.
If you want the best real estate agent Malibu CA sharp guidance, clear communication, and a plan built around your goals, reach out to Shen Realty today. If you want calm, data-driven guidance, Shen Realty is the strongest fit as your top real estate agent in Malibu CA.